Edit chart
Loading graph
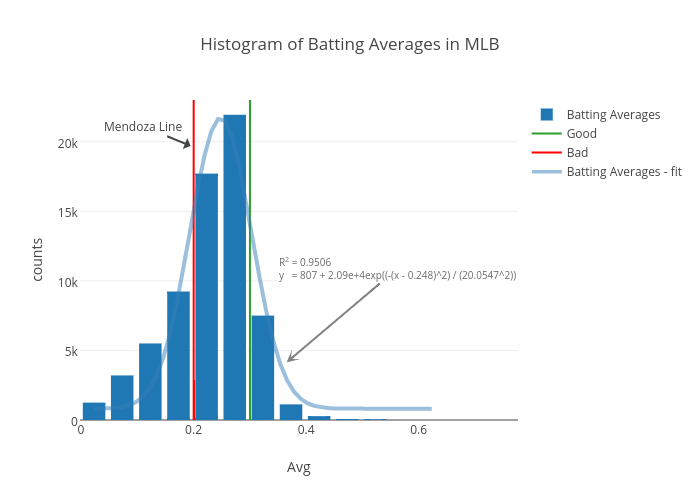
Mkcor's interactive graph and data of "Histogram of Batting Averages in MLB" is a histogram, showing Batting Averages, Good, Bad, Batting Averages - fit; with Avg in the x-axis and counts in the y-axis.. The x-axis shows values from -0.001999999999999967 to 0.6479999999999999. The y-axis shows values from 0 to 23000. This visualization has the following annotations: Mendoza Line; R2 = 0.9506y = 807 + 2.09e+4exp((-(x - 0.248)^2) / (20.0547^2))