Edit chart
Loading graph
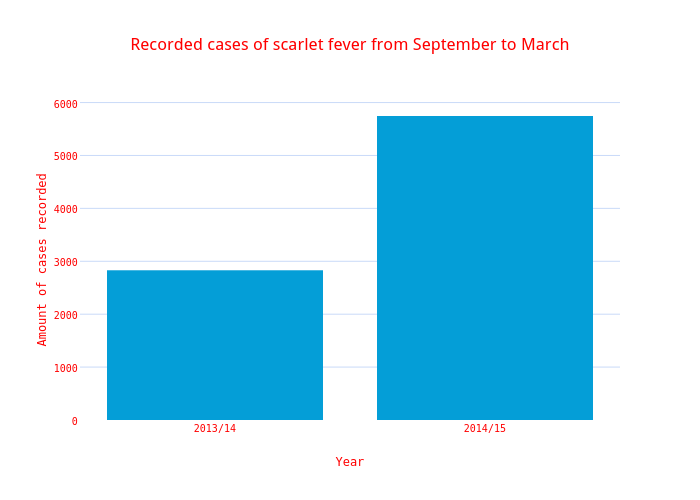
Mkeyw001's interactive graph and data of "Recorded cases of scarlet fever from September to March" is a bar chart, showing Col2; with Year in the x-axis and Amount of cases recorded in the y-axis.. The x-axis shows values from -0.5 to 1.5. The y-axis shows values from 0 to 6048.421052631579.