Edit chart
Loading graph
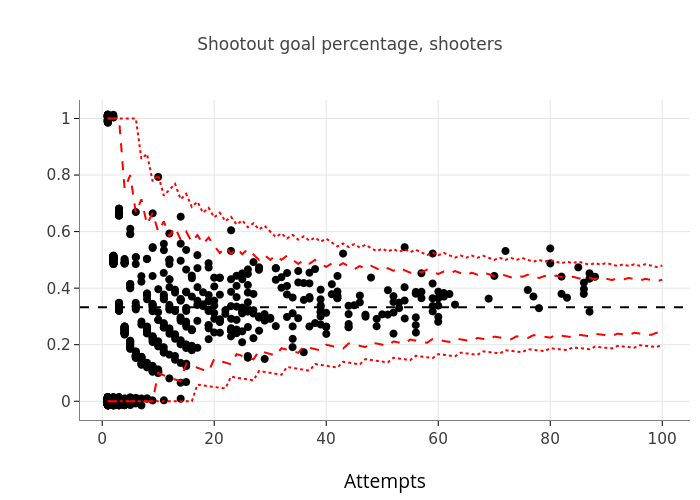
Mlopez1's interactive graph and data of "Shootout goal percentage, shooters" is a scatter chart, showing None, None, None, None, None, None; with Attempts in the x-axis. The x-axis shows values from -3.96559575951926 to 104.950742655215. The y-axis shows values from -0.0663440026831813 to 1.06543046836043.