Edit chart
Loading graph
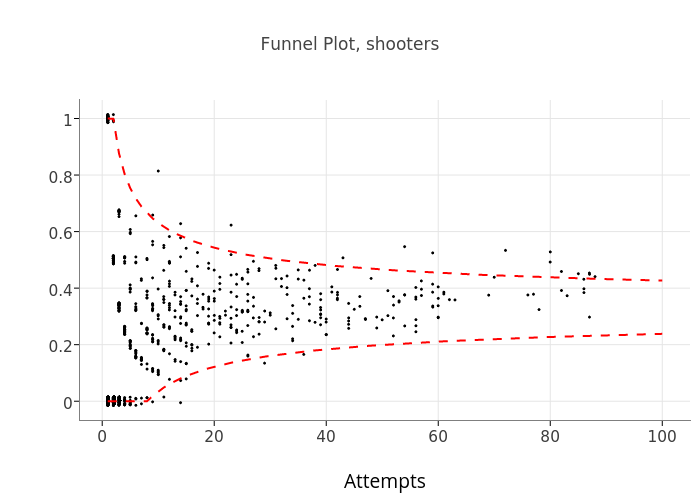
Mlopez1's interactive graph and data of "Funnel Plot, shooters" is a scatter chart, showing None, None, None; with Attempts in the x-axis. The x-axis shows values from -3.9657222798916 to 104.950748679995. The y-axis shows values from -0.0664370581911644 to 1.06543234054546.