Edit chart
Loading graph
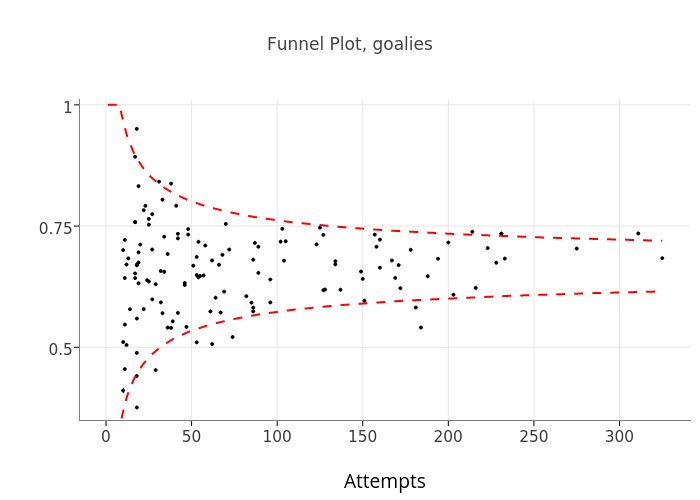
Mlopez1's interactive graph and data of "Funnel Plot, goalies" is a scatter chart, showing None, None, None; with Attempts in the x-axis. The x-axis shows values from -15.2 to 341.2. The y-axis shows values from 0.35 to 1.01.