Edit chart
Loading graph
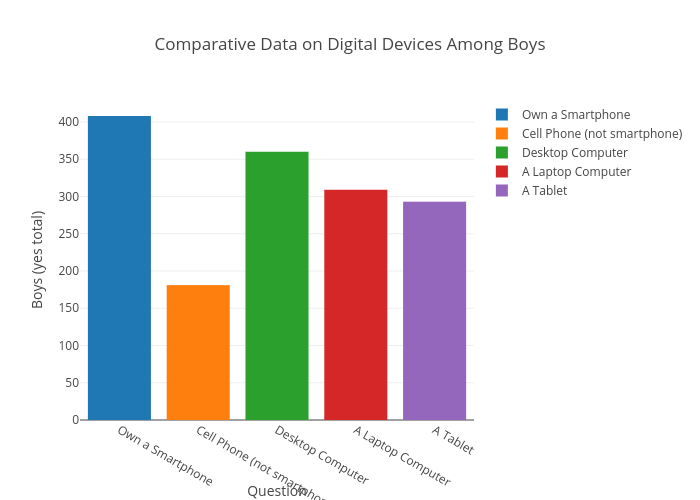
Mollyvp's interactive graph and data of "Comparative Data on Digital Devices Among Boys" is a grouped bar chart, showing Own a Smartphone, Cell Phone (not smartphone), Desktop Computer, A Laptop Computer, A Tablet; with Question in the x-axis and Boys (yes total) in the y-axis.. The x-axis shows values from -0.5 to 4.5. The y-axis shows values from 0 to 429.4736842105263.