Edit chart
Loading graph
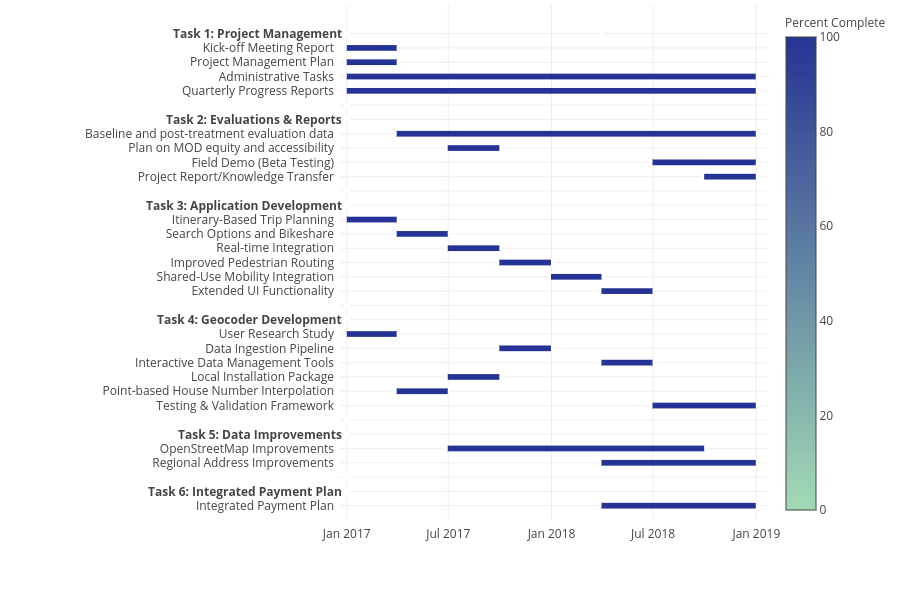
Mosteele's interactive graph and data of ", , , , , , , , , , , , , , , , , , , , , , , , , , , , , , , , , , " is a scatter chart, showing , , , , , , , , , , , , , , , , , , , , , , , , , , , , , , , , , , ; with time in the x-axis. The x-axis shows values from 1482192000000.0 to 1547942400000.0. The y-axis shows values from -1 to 35. This visualization has the following annotations: Task 1: Project Management; Task 2: Evaluations & Reports; Task 3: Application Development; Task 4: Geocoder Development; Task 5: Data Improvements; Task 6: Integrated Payment Plan