Edit chart
Loading graph
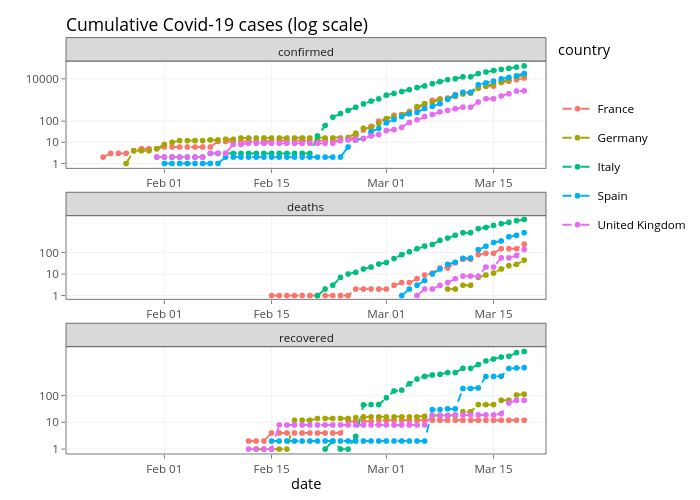
Mpalanco's interactive graph and data of "Cumulative Covid-19 cases (log scale)" is a line chart, showing France, France, France, Germany, Germany, Germany, Italy, Italy, Italy, Spain, Spain, Spain, United Kingdom, United Kingdom, United Kingdom. The x-axis shows values from 18280.15 to 18342.85. The y-axis shows values from -0.230657721887963 to 4.84381215964723. This visualization has the following annotations: date; confirmed; deaths; recovered; country