Edit chart
Loading graph
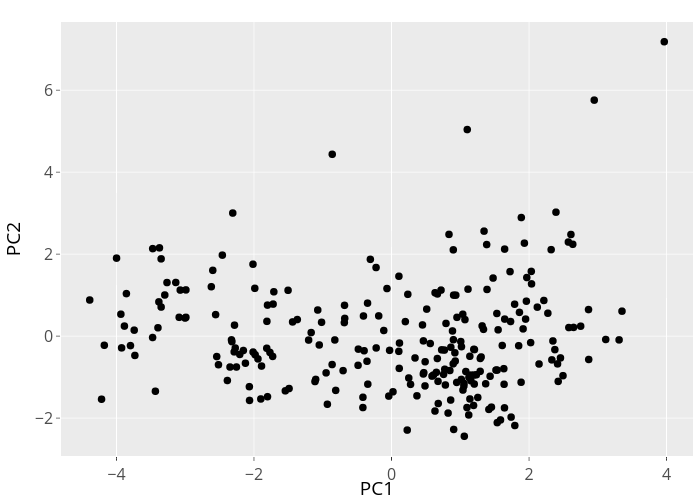
Mrichards25's interactive graph and data of "PC2 vs PC1" is a scatter chart; with PC1 in the x-axis and PC2 in the y-axis.. The x-axis shows values from -4.80603887655542 to 4.38399879587948. The y-axis shows values from -2.92475834177718 to 7.66266096969646.