Edit chart
Loading graph
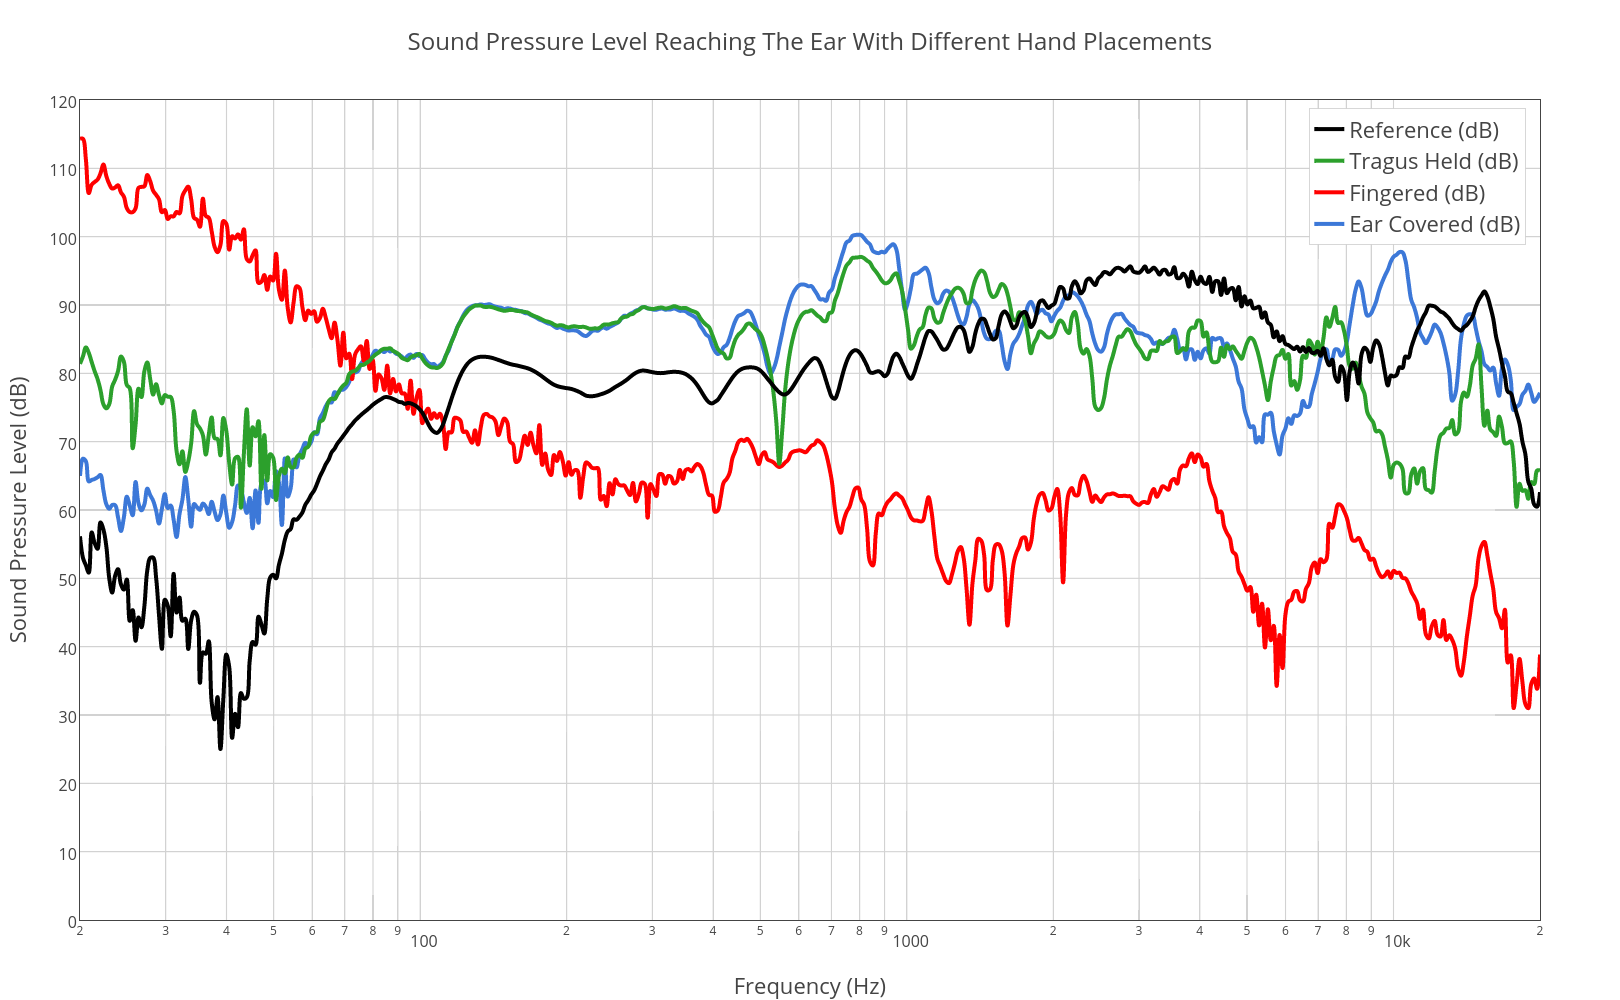
Mrlyule's interactive graph and data of "Sound Pressure Level Reaching The Ear With Different Hand Placements" is a scatter chart, showing Ear Covered (dB), Fingered (dB), Tragus Held (dB), Reference (dB); with Frequency (Hz) in the x-axis and Sound Pressure Level (dB) in the y-axis.. The x-axis shows values from 1.301029995663981 to 4.30102999566398. The y-axis shows values from 0 to 120.