Edit chart
Loading graph
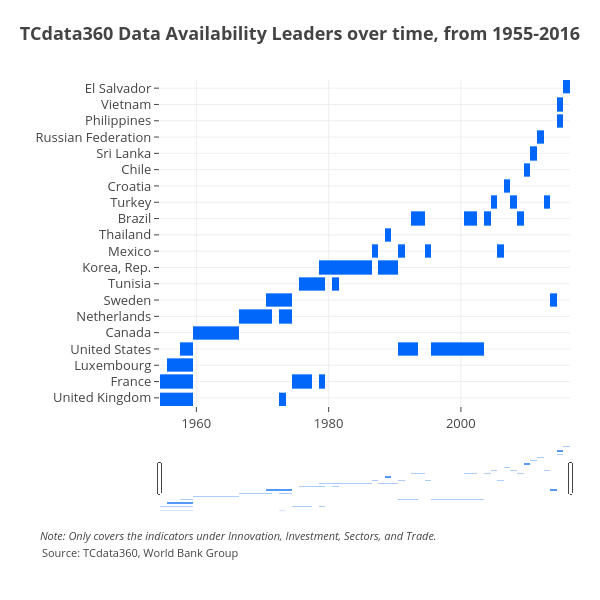
Mrpsonglao's interactive graph and data of "TCdata360 Data Availability Leaders over time, from 1955-2016" is a heatmap. The x-axis shows values from 1954.5 to 2016.5. The y-axis shows values from -0.5 to 19.5. This visualization has the following annotations: Source: TCdata360, World Bank Group; Note: Only covers the indicators under Innovation, Investment, Sectors, and Trade.