Edit chart
Loading graph
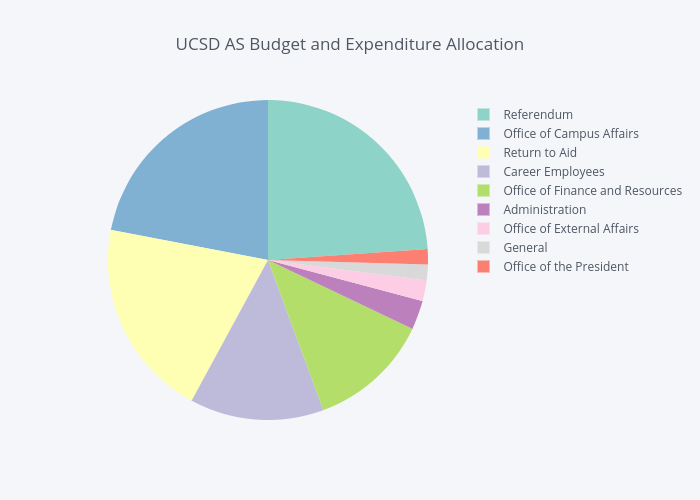
Msheker's interactive graph and data of "UCSD AS Budget and Expenditure Allocation" is a pie. The x-axis shows values from 0 to 0. The y-axis shows values from 0 to 0.