Edit chart
Loading graph
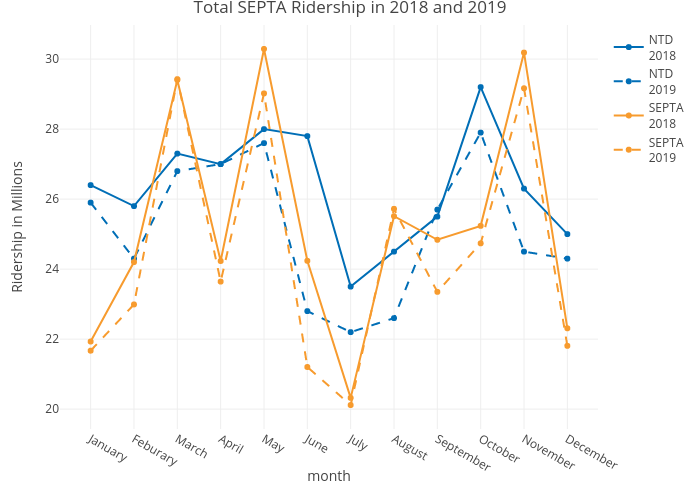
Mshields417's interactive graph and data of "Total SEPTA Ridership in 2018 and 2019" is a line chart, showing NTD2018, NTD2019, SEPTA2018, SEPTA2019; with month in the x-axis and Ridership in Millions in the y-axis.. The x-axis shows values from 0 to 0. The y-axis shows values from 0 to 0.