Edit chart
Loading graph
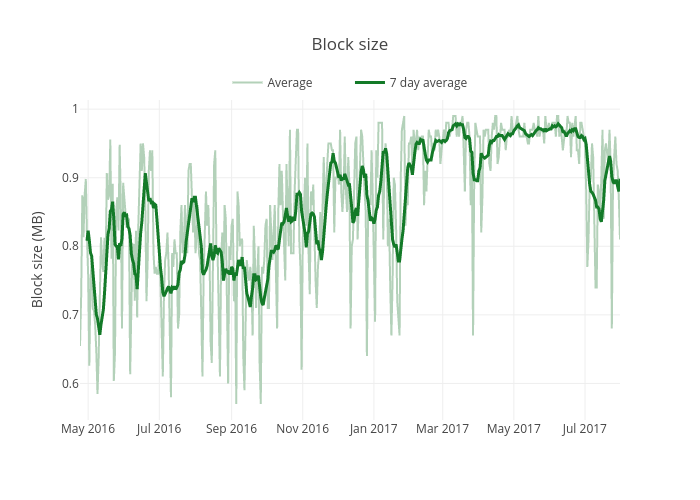
Mthwsjc's interactive graph and data of "Block size" is a scatter chart, showing Average vs 7 day average; with Block size (MB) in the y-axis. The x-axis shows values from 0 to 0. The y-axis shows values from 0 to 0.