Edit chart
Loading graph
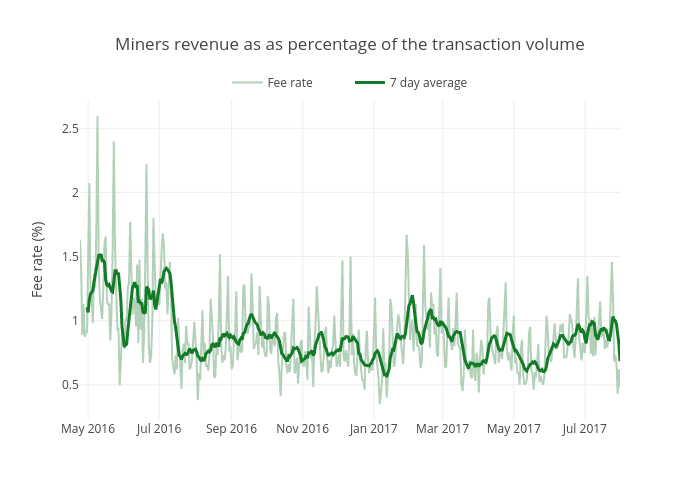
Mthwsjc's interactive graph and data of "Miners revenue as as percentage of the transaction volume" is a scatter chart, showing Fee rate vs 7 day average; with Fee rate (%) in the y-axis. The x-axis shows values from 0 to 0. The y-axis shows values from 0 to 0.