Edit chart
Loading graph
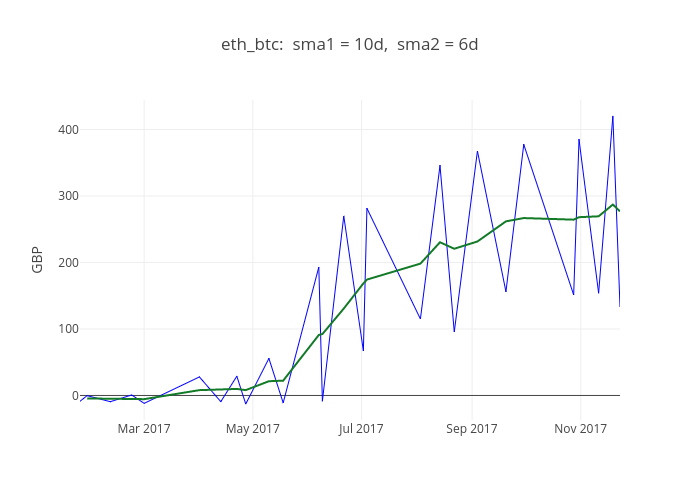
Mthwsjc's interactive graph and data of "eth_btc: sma1 = 10d, sma2 = 6d" is a scatter chart, showing eth_btc vs av; with GBP in the y-axis. The x-axis shows values from 0 to 0. The y-axis shows values from 0 to 0.