Edit chart
Loading graph
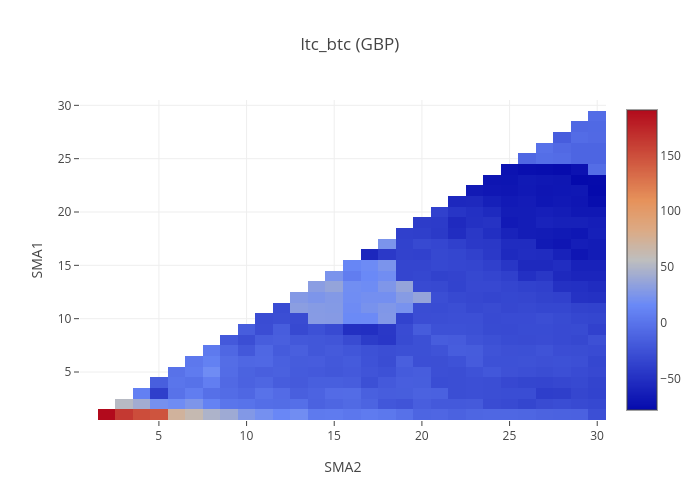
Mthwsjc's interactive graph and data of "ltc_btc (GBP)" is a heatmap; with SMA2 in the x-axis and SMA1 in the y-axis.. The x-axis shows values from 0 to 0. The y-axis shows values from 0 to 0.