Edit chart
Loading graph
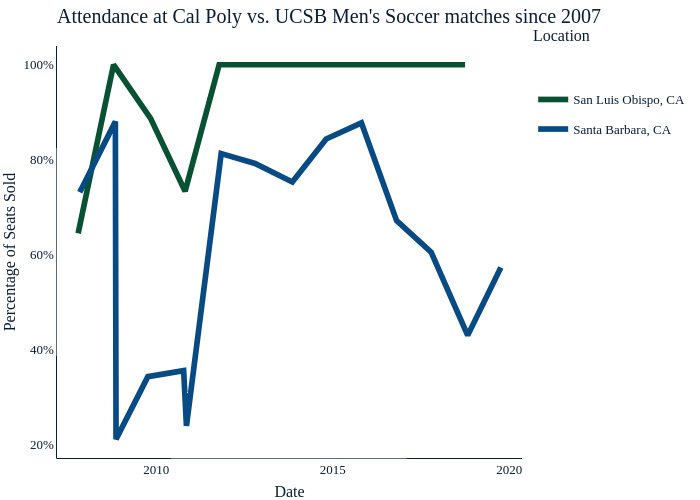
Mustangmedia's interactive graph and data of "Attendance at Cal Poly vs. UCSB Men's Soccer matches since 2007" is a line chart, showing San Luis Obispo, CA vs Santa Barbara, CA; with Date in the x-axis and Percentage of Seats Sold in the y-axis.. The x-axis shows values from 13584.45 to 18392.55. The y-axis shows values from 0.17241470545 to 1.03940882355. This visualization has the following annotation: Location