Edit chart
Loading graph
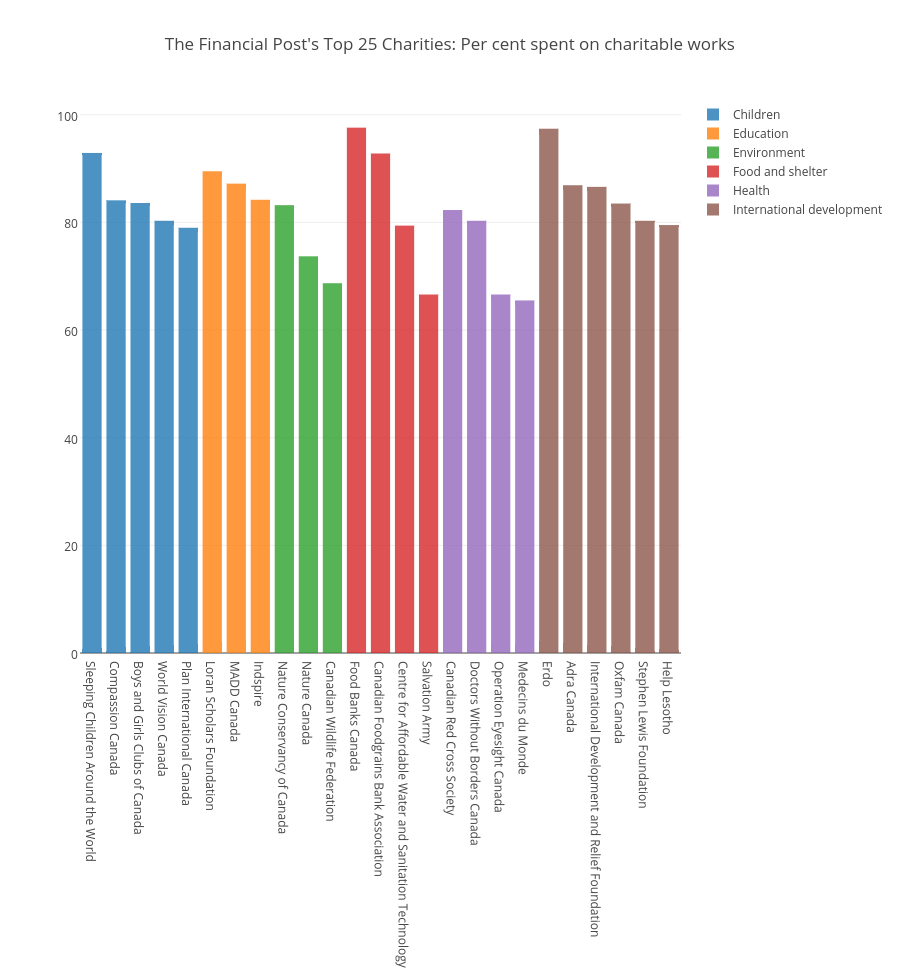
Mwarzecha's interactive graph and data of "The Financial Post's Top 25 Charities: Per cent spent on charitable works" is a grouped bar chart, showing Children, Education, Environment, Food and shelter, Health, International development. The x-axis shows values from -0.5 to 24.5. The y-axis shows values from 0 to 1.0273684210526315.