Edit chart
Loading graph
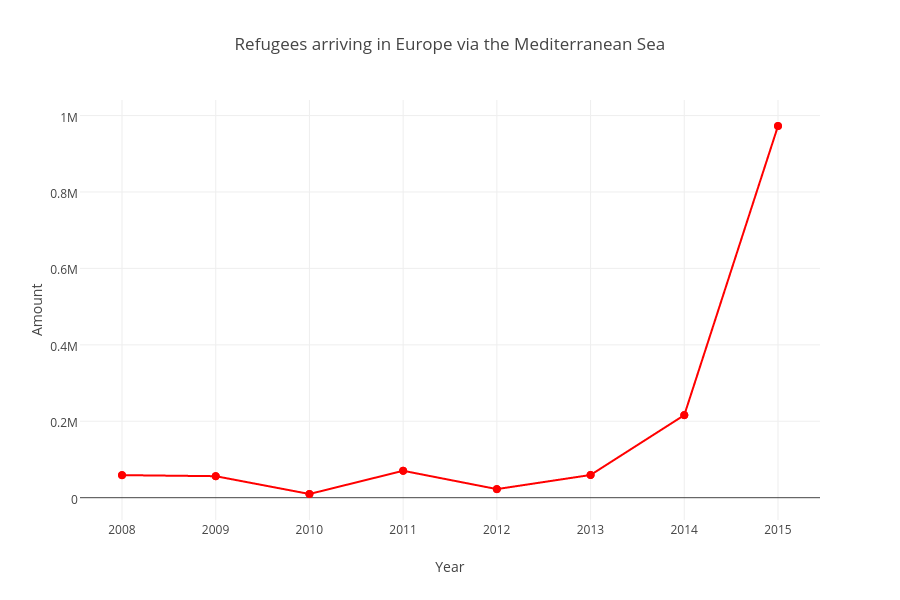
Mwarzecha's interactive graph and data of "Refugees arriving in Europe via the Mediterranean Sea" is a line chart, showing Amount; with Year in the x-axis and Amount in the y-axis.. The x-axis shows values from 2007.5518292682927 to 2015.4481707317073. The y-axis shows values from -58376.766304347824 to 1040581.7663043478.