Edit chart
Loading graph
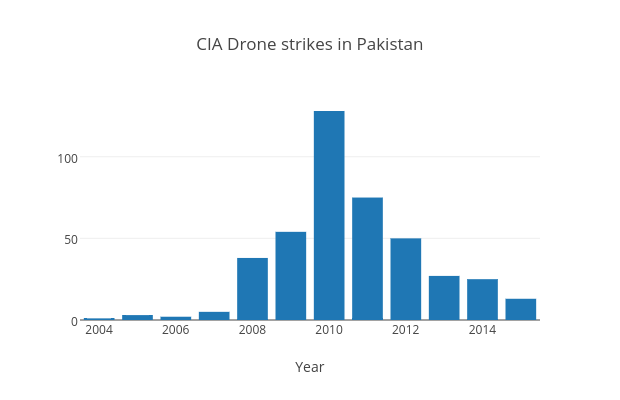
Mwarzecha's interactive graph and data of "CIA Drone strikes in Pakistan" is a bar chart, showing CIA Drone Strikes; with Year in the x-axis. The x-axis shows values from 2003.5 to 2015.5. The y-axis shows values from 0 to 134.73684210526315.