Edit chart
Loading graph
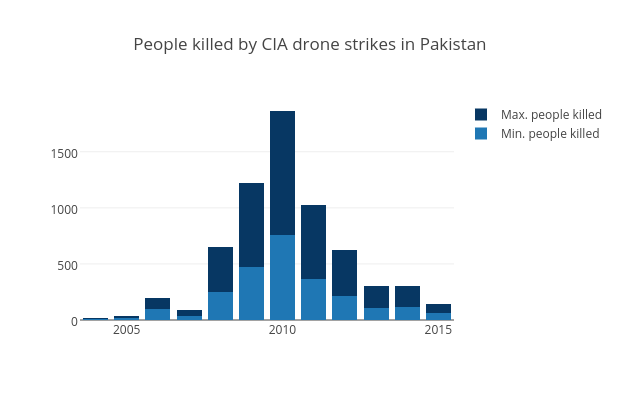
Mwarzecha's interactive graph and data of "People killed by CIA drone strikes in Pakistan" is a stacked bar chart, showing Min. people killed vs Max. people killed. The x-axis shows values from 2003.5 to 2015.5. The y-axis shows values from 0 to 1961.0526315789473.