Edit chart
Loading graph
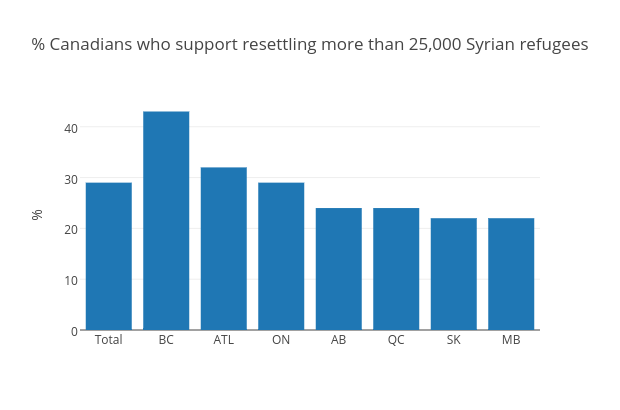
Mwarzecha's interactive graph and data of "% Canadians who support resettling more than 25,000 Syrian refugees" is a bar chart, showing Col2; with % in the y-axis. The x-axis shows values from -0.5 to 7.5. The y-axis shows values from 0 to 45.26315789473684.