Edit chart
Loading graph
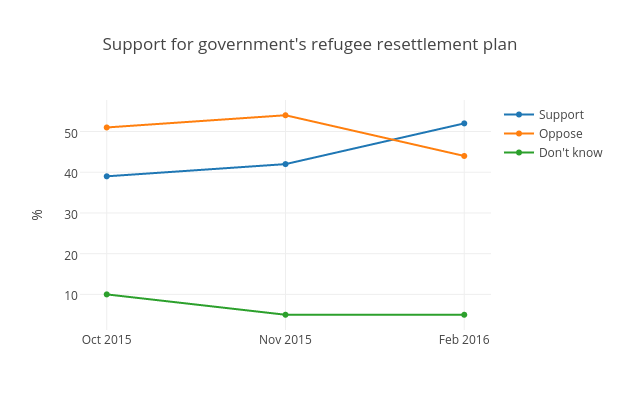
Mwarzecha's interactive graph and data of "Support for government's refugee resettlement plan" is a scatter chart, showing Support, Oppose, Don't know; with % in the y-axis. The x-axis shows values from -0.13410596026490068 to 2.134105960264901. The y-axis shows values from 1.2543859649122808 to 57.74561403508772.