Edit chart
Loading graph
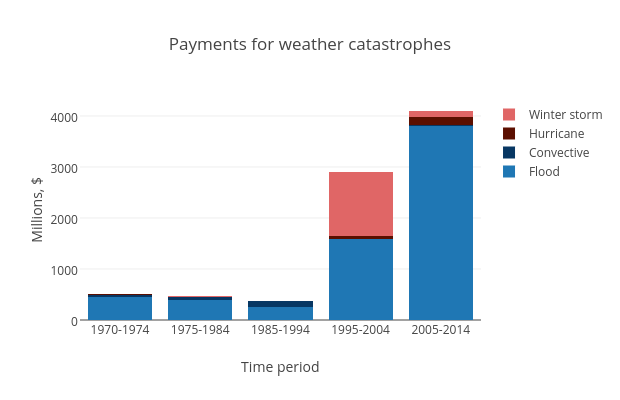
Mwarzecha's interactive graph and data of "Payments for weather catastrophes" is a stacked bar chart, showing Flood, Convective, Hurricane, Winter storm; with Time period in the x-axis and Millions, $ in the y-axis.. The x-axis shows values from -0.5 to 4.5. The y-axis shows values from 0 to 4312.631578947368.