Edit chart
Loading graph
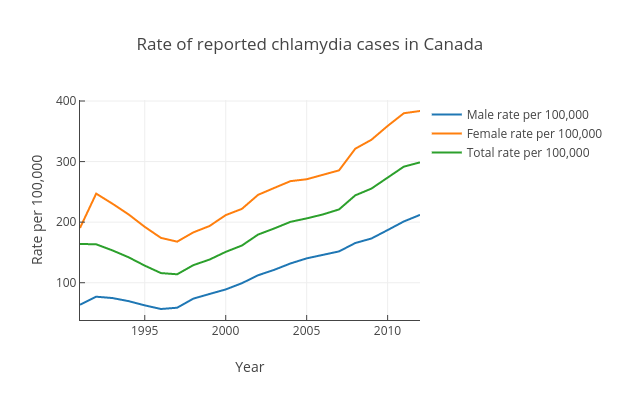
Mwarzecha's interactive graph and data of "Rate of reported chlamydia cases in Canada" is a scatter chart, showing Male rate per 100,000, Female rate per 100,000, Total rate per 100,000; with Year in the x-axis and Rate per 100,000 in the y-axis.. The x-axis shows values from 1991 to 2012. The y-axis shows values from 38.4388888888889 to 401.6611111111111.