Edit chart
Loading graph
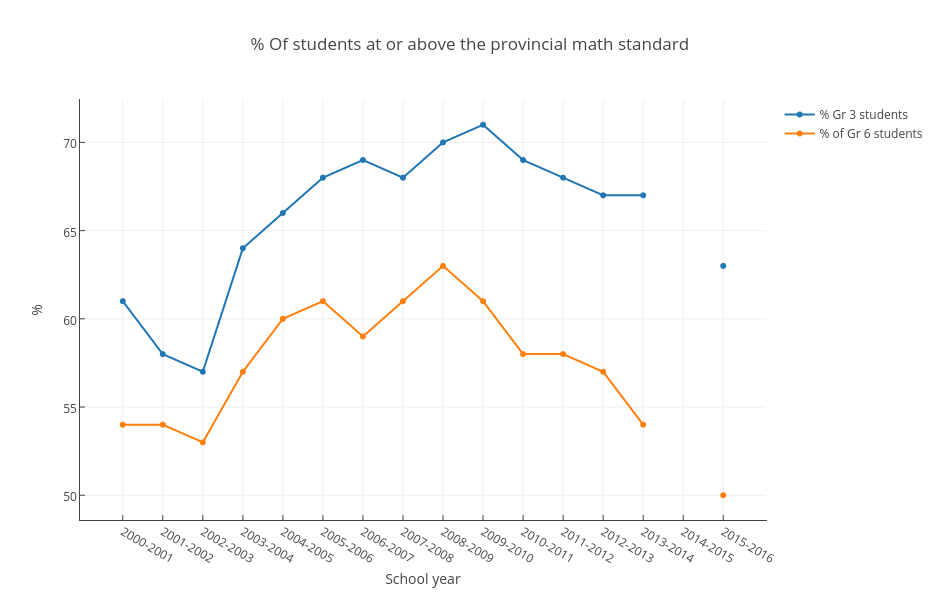
Mwarzecha's interactive graph and data of "% Of students at or above the provincial math standard" is a scatter chart, showing % Gr 3 students vs % of Gr 6 students; with School year in the x-axis and % in the y-axis.. The x-axis shows values from -0.9358091490408263 to 15.935809149040827. The y-axis shows values from 48.597165991902834 to 72.40283400809716.