Edit chart
Loading graph
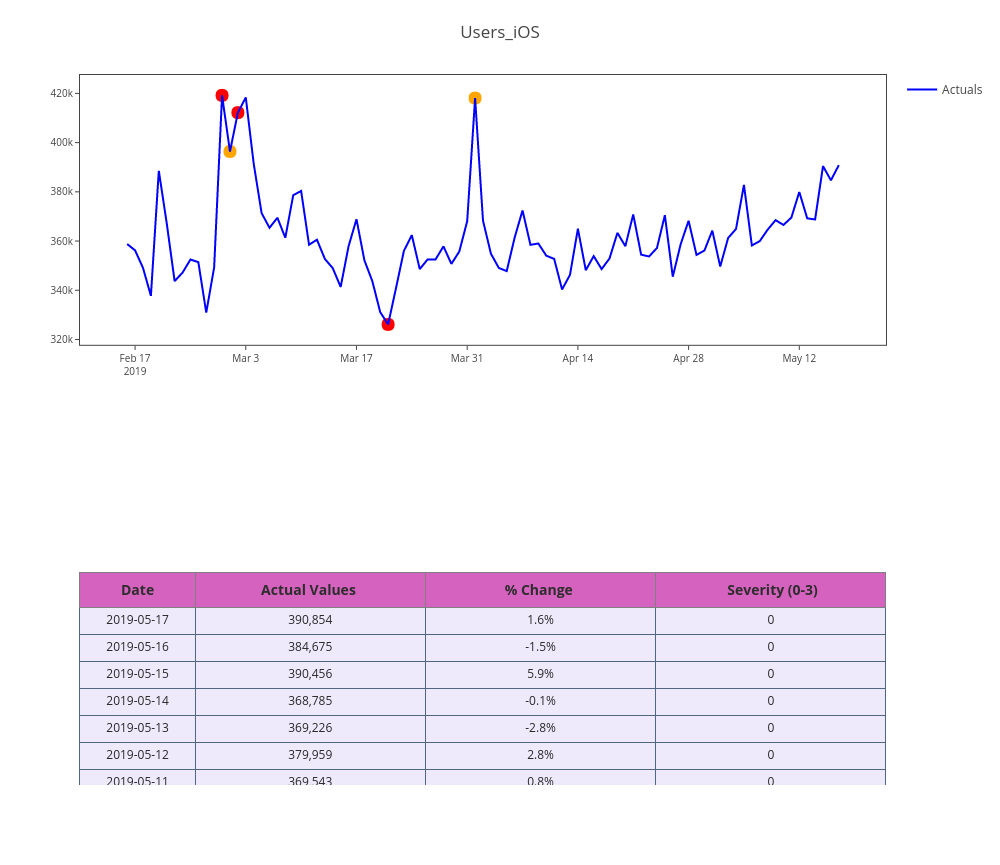
Myntra's interactive graph and data of "Users_iOS" is a table, showing anomaly actual vs Actuals. The x-axis shows values from 0 to 0. The y-axis shows values from 0 to 0.