Edit chart
Loading graph
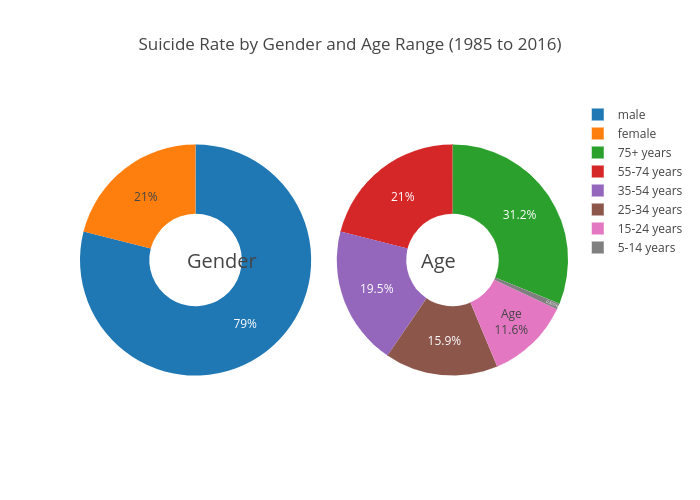
Nat236919's interactive graph and data of "Suicide Rate by Gender and Age Range (1985 to 2016)" is a pie, showing Sex vs Age Range. The x-axis shows values from 0 to 0. The y-axis shows values from 0 to 0. This visualization has the following annotations: Gender; Age