Edit chart
Loading graph
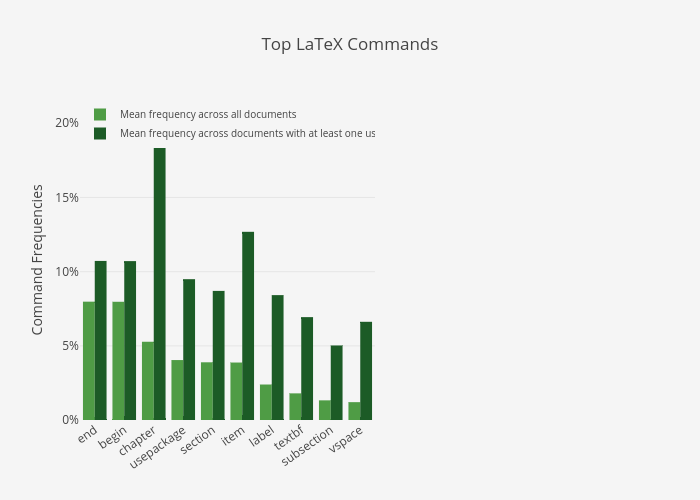
Natetan's interactive graph and data of "Top LaTeX Commands" is a grouped bar chart, showing Mean frequency across all documents vs Mean frequency across documents with at least one use; with Command Frequencies in the y-axis. The x-axis shows values from 0 to 0. The y-axis shows values from 0 to 0.