Edit chart
Loading graph
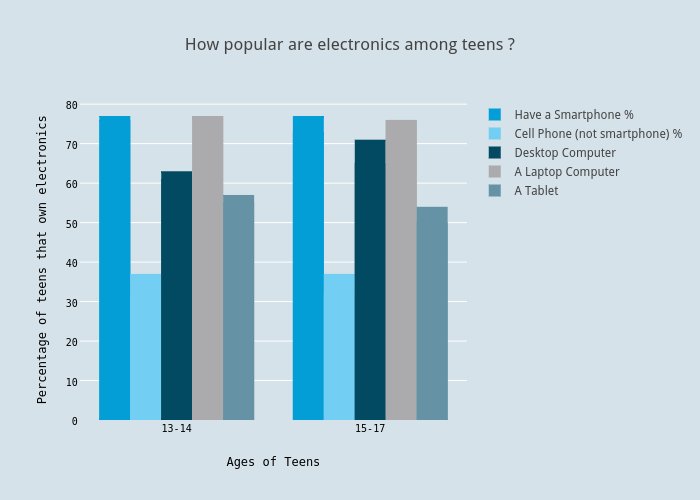
Ndmeans's interactive graph and data of "How popular are electronics among teens ?" is a bar chart, showing Have a Smartphone %, Cell Phone (not smartphone) %, Desktop Computer, A Laptop Computer, A Tablet; with Ages of Teens in the x-axis and Percentage of teens that own electronics in the y-axis.. The x-axis shows values from -0.5 to 1.5. The y-axis shows values from 0 to 81.05263157894737.