Edit chart
Loading graph
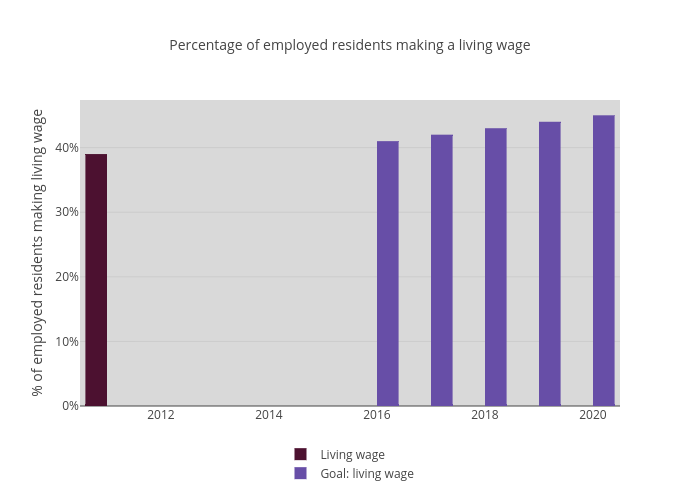
Newhavenctp's interactive graph and data of "Percentage of employed residents making a living wage" is a bar chart, showing Living wage vs Goal: living wage; with % of employed residents making living wage in the y-axis. The x-axis shows values from 2010.5 to 2020.5. The y-axis shows values from 0 to 47.36842105263158.