Edit chart
Loading graph
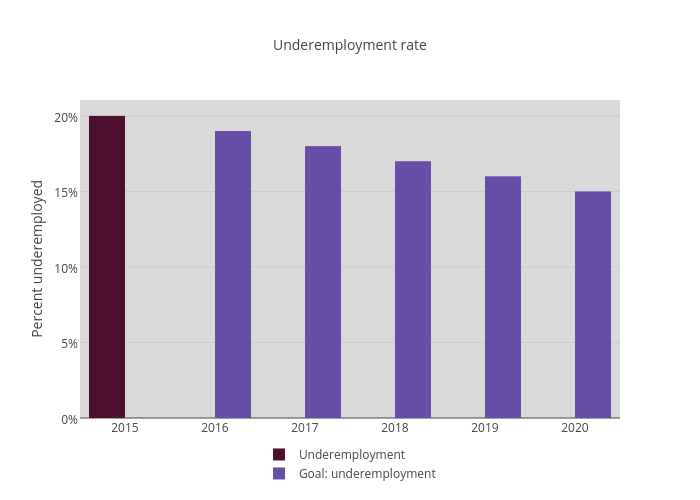
Newhavenctp's interactive graph and data of "Underemployment rate" is a bar chart, showing Underemployment vs Goal: underemployment; with Percent underemployed in the y-axis. The x-axis shows values from 2014.5 to 2020.5. The y-axis shows values from 0 to 21.05263157894737.