Edit chart
Loading graph
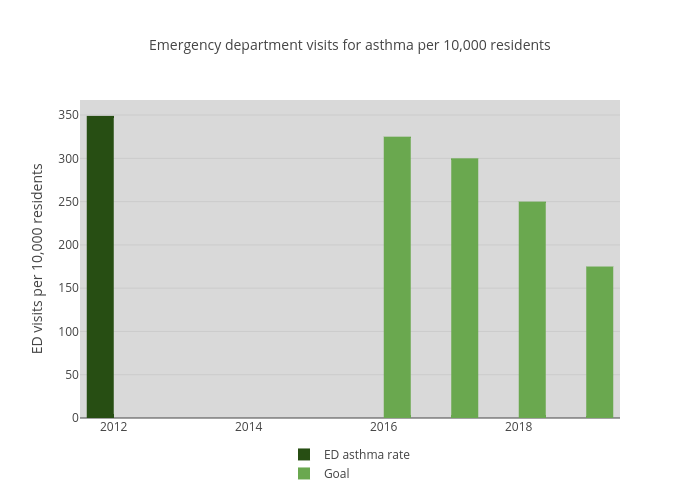
Newhavenctp's interactive graph and data of "Emergency department visits for asthma per 10,000 residents" is a bar chart, showing ED asthma rate vs Goal; with ED visits per 10,000 residents in the y-axis. The x-axis shows values from 2011.5 to 2019.5. The y-axis shows values from 0 to 367.36842105263156.