Edit chart
Loading graph
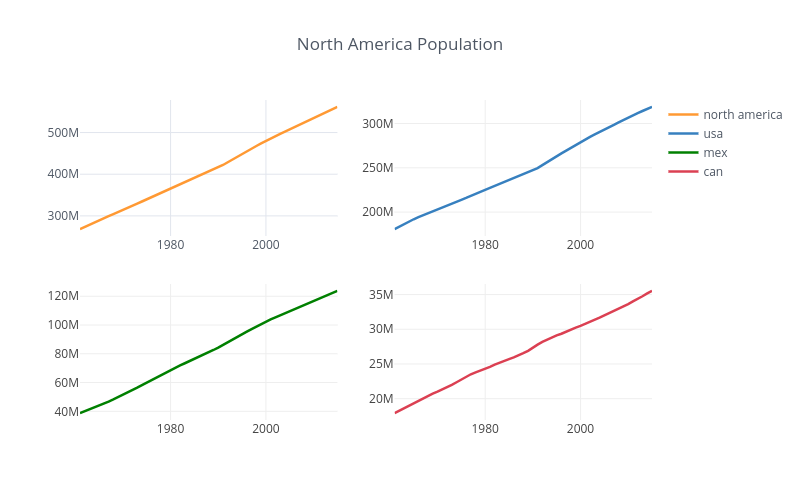
Nheitzman1's interactive graph and data of "North America Population" is a line chart, showing north america, usa, mex, can. The x-axis shows values from -284065200000 to 1420002000000. The y-axis shows values from 251765391.7222222 to 577985077.2777778.