Edit chart
Loading graph
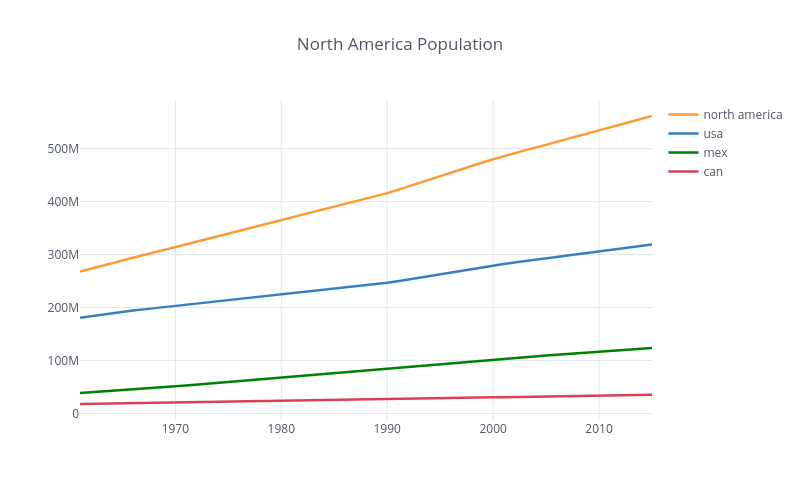
Nheitzman1's interactive graph and data of "North America Population" is a line chart, showing north america, usa, mex, can. The x-axis shows values from 0 to 0. The y-axis shows values from 0 to 0.