Edit chart
Loading graph
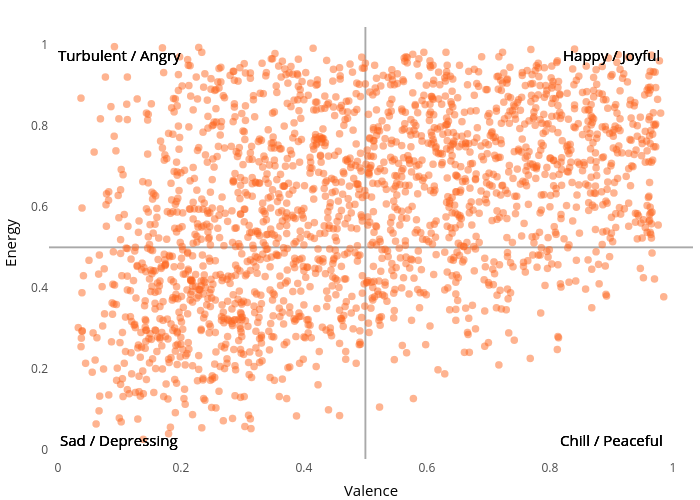
Nickkuiper's interactive graph and data of "Energy vs Valence" is a line chart; with Valence in the x-axis and Energy in the y-axis.. The x-axis shows values from -0.01439 to 1.03259. The y-axis shows values from -0.02203 to 1.04343. This visualization has the following annotations: Sad / Depressing; Sad / Depressing; Sad / Depressing; Happy / Joyful; Happy / Joyful; Happy / Joyful; Turbulent / Angry; Turbulent / Angry; Turbulent / Angry; Chill / Peaceful; Chill / Peaceful; Chill / Peaceful