Edit chart
Loading graph
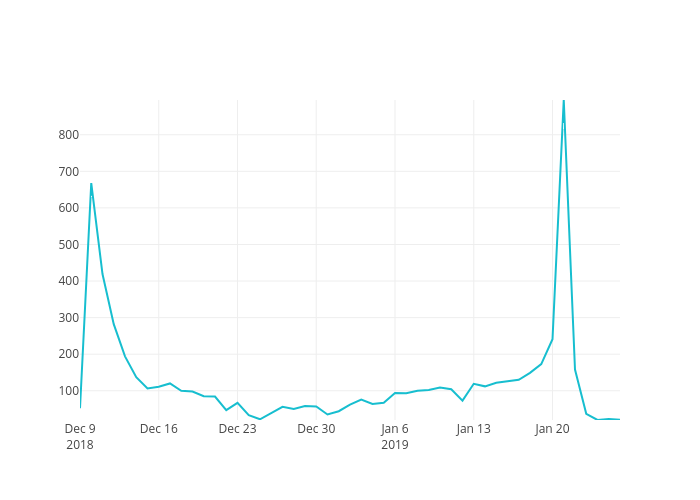
Nickw444's interactive graph and data of "Images collected per day" is a line chart; with Day in the x-axis and Images Collected in the y-axis.. The x-axis shows values from 2018-12-09 to 2019-01-26. The y-axis shows values from 20 to 895.