Edit chart
Loading graph
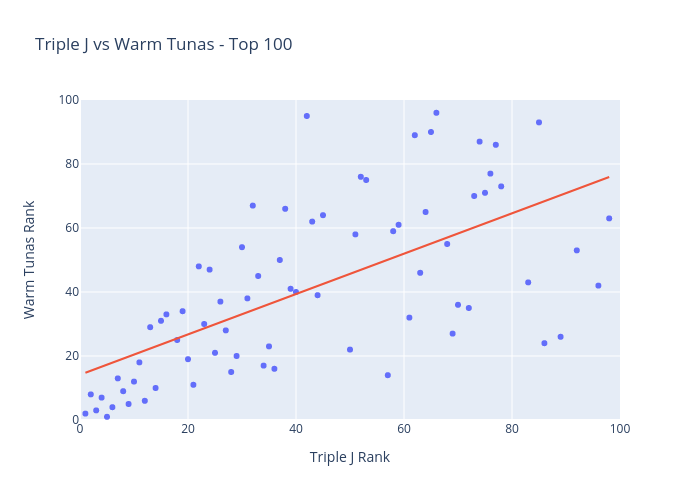
Nickw444's interactive graph and data of "Triple J vs Warm Tunas - Top 100" is a scatter chart, showing Fit; with Triple J Rank in the x-axis and Warm Tunas Rank in the y-axis.. The x-axis shows values from 0 to 100. The y-axis shows values from 0 to 100.