Edit chart
Loading graph
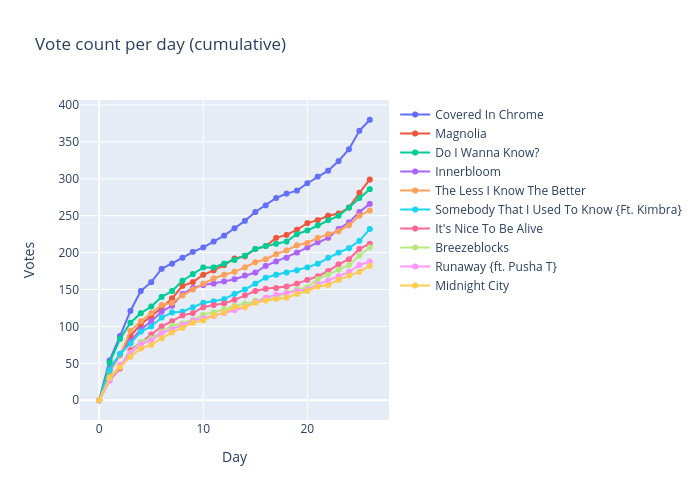
Nickw444's interactive graph and data of "Vote count per day (cumulative)" is a line chart, showing Covered In Chrome, Magnolia, Do I Wanna Know?, Innerbloom, The Less I Know The Better, Somebody That I Used To Know {Ft. Kimbra}, It's Nice To Be Alive, Breezeblocks, Runaway {ft. Pusha T}, Midnight City; with Day in the x-axis and Votes in the y-axis.. The x-axis shows values from -1.594220931840177 to 27.594220931840177. The y-axis shows values from -23.08190191685337 to 403.0819019168534.