Edit chart
Loading graph
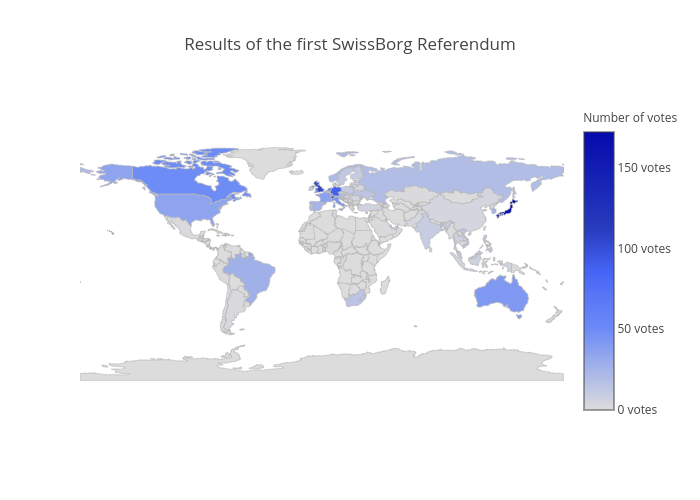
Nicoborg's interactive graph and data of "Results of the first SwissBorg Referendum" is a choropleth. The x-axis shows values from 0 to 0. The y-axis shows values from 0 to 0.