Edit chart
Loading graph
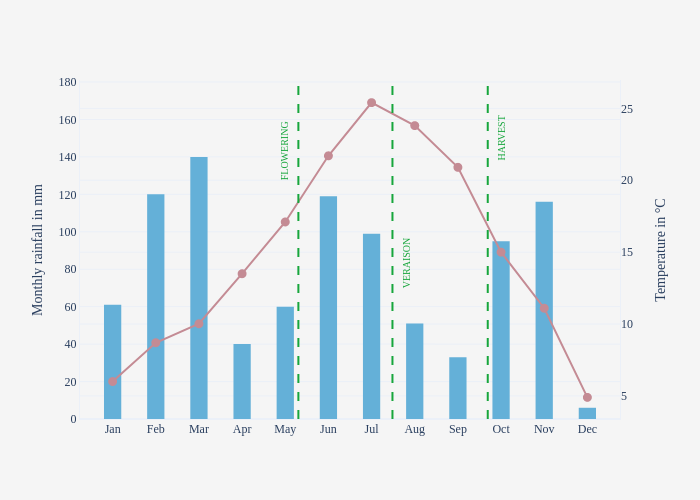
Nicoleasy's interactive graph and data of "{'x': 0.05}" is a , showing Temperature in °C vs Monthly rainfall in mm; with in the x-axis and Monthly rainfall in mm in the y-axis.. The x-axis shows values from -0.67453069507864 to 11.67453069507864. The y-axis shows values from -0.21803273023801614 to 180.74913336731538. This visualization has the following annotations: FLOWERING; VERAISON; HARVEST