Edit chart
Loading graph
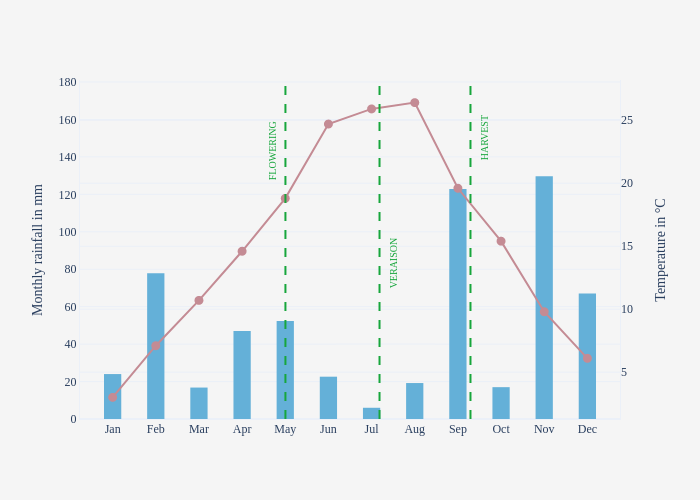
Nicoleasy's interactive graph and data of "{'x': 0.05}" is a , showing Temperature in °C vs Monthly rainfall in mm; with in the x-axis and Monthly rainfall in mm in the y-axis.. The x-axis shows values from -0.6596273949401926 to 11.659627394940193. The y-axis shows values from -0.22454116994661366 to 180.75564180702398. This visualization has the following annotations: FLOWERING; VERAISON; HARVEST