Edit chart
Loading graph
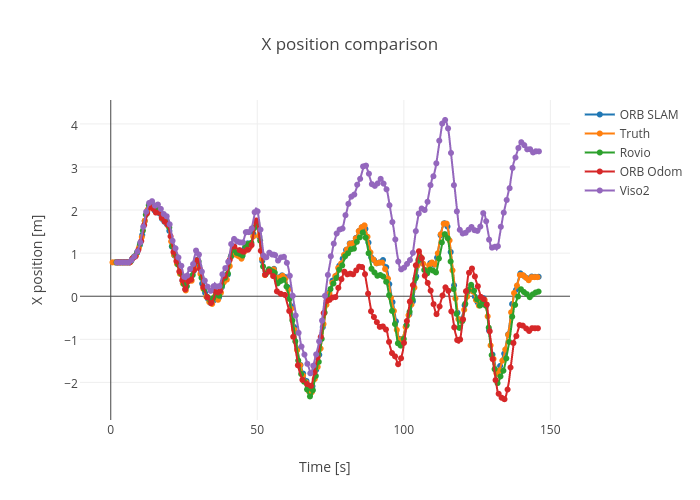
Nikoperugia's interactive graph and data of "X position comparison" is a line chart, showing ORB SLAM, Truth, Rovio, ORB Odom, Viso2; with Time [s] in the x-axis and X position [m] in the y-axis.. The x-axis shows values from 0 to 0. The y-axis shows values from 0 to 0.