Edit chart
Loading graph
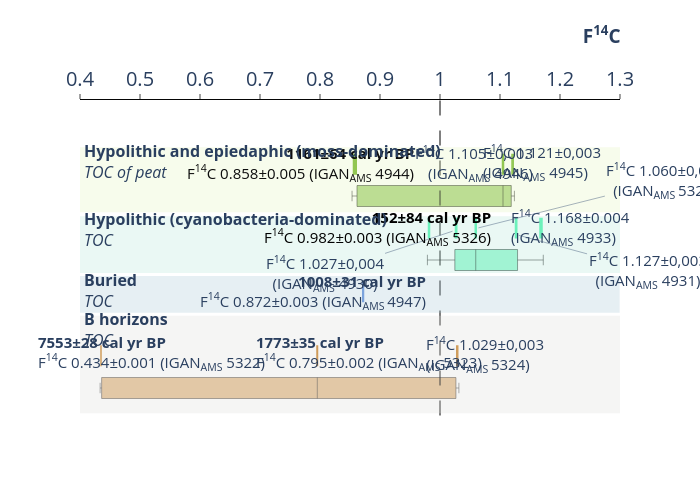
Nikvox's interactive graph and data of "B, B, B, Hypolithic buried, Hypolithic cyanobacteria dominated, Hypolithic cyanobacteria dominated, Hypolithic cyanobacteria dominated, Hypolithic cyanobacteria dominated, Hypolithic cyanobacteria dominated, Epiedaphic moss peat, Epiedaphic moss peat, Epiedaphic moss peat" is a box plot, showing B, B, B, Hypolithic buried, Hypolithic cyanobacteria dominated, Hypolithic cyanobacteria dominated, Hypolithic cyanobacteria dominated, Hypolithic cyanobacteria dominated, Hypolithic cyanobacteria dominated, Epiedaphic moss peat, Epiedaphic moss peat, Epiedaphic moss peat; with F14C in the x-axis. The x-axis shows values from 0.4 to 1.3. The y-axis shows values from -1.0072254335260116 to 4.007225433526012. This visualization has the following annotations: F14C 1.121±0,003(IGANAMS 4945); F14C 1.105±0,003(IGANAMS 4946); 1161±64 cal yr BPF14C 0.858±0.005 (IGANAMS 4944); F14C 1.168±0.004(IGANAMS 4933); F14C 1.127±0,003(IGANAMS 4931); F14C 1.060±0,003(IGANAMS 5325); F14C 1.027±0,004(IGANAMS 4930); 152±84 cal yr BPF14C 0.982±0.003 (IGANAMS 5326); F14C 1.029±0,003(IGANAMS 5324); 1008±31 cal yr BPF14C 0.872±0.003 (IGANAMS 4947); 1773±35 cal yr BPF14C 0.795±0.002 (IGANAMS 5323); 7553±28 cal yr BPF14C 0.434±0.001 (IGANAMS 5322); Hypolithic and epiedaphic (moss-dominated)TOC of peat; Hypolithic (cyanobacteria-dominated)TOC; BuriedTOC; B horizonsTOC