Edit chart
Loading graph
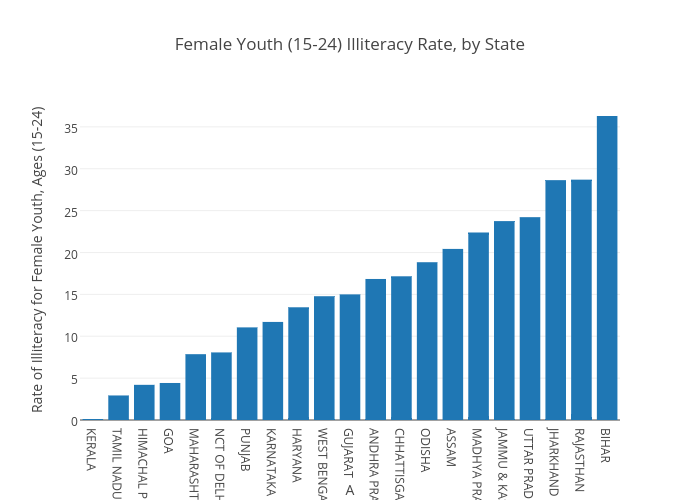
Nilakar's interactive graph and data of "Female Youth (15-24) Illiteracy Rate, by State" is a bar chart, showing B; with A in the x-axis and Rate of Illiteracy for Female Youth, Ages (15-24) in the y-axis.. The x-axis shows values from -0.5 to 20.5. The y-axis shows values from 0 to 38.21052631578947.