Edit chart
Loading graph
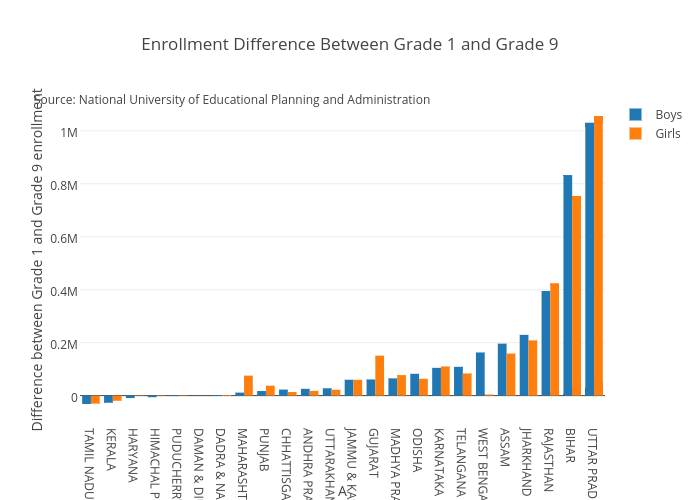
Nilakar's interactive graph and data of "Enrollment Difference Between Grade 1 and Grade 9" is a bar chart, showing Boys vs Girls; with A in the x-axis and Difference between Grade 1 and Grade 9 enrollment in the y-axis.. The x-axis shows values from -0.5 to 23.5. The y-axis shows values from -92084.11111111112 to 1116098.111111111. This visualization has the following annotation: Source: National University of Educational Planning and Administration