Edit chart
Loading graph
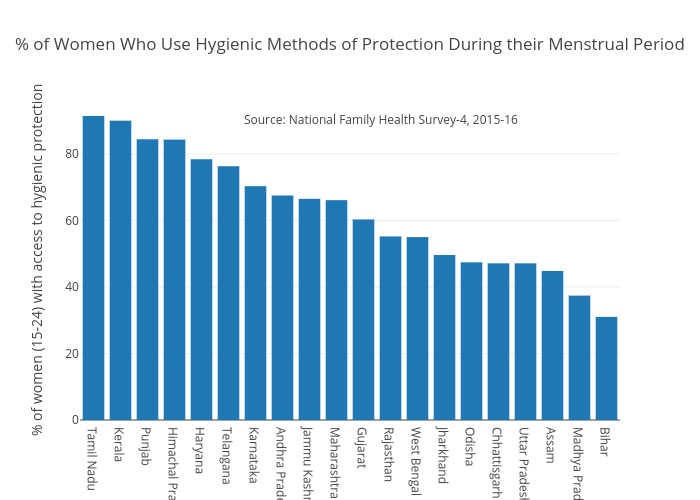
Nilakar's interactive graph and data of "% of Women Who Use Hygienic Methods of Protection During their Menstrual Period" is a bar chart, showing B; with % of women (15-24) with access to hygienic protection in the y-axis. The x-axis shows values from -0.5 to 19.5. The y-axis shows values from 0 to 96.21052631578948. This visualization has the following annotation: Source: National Family Health Survey-4, 2015-16