Edit chart
Loading graph
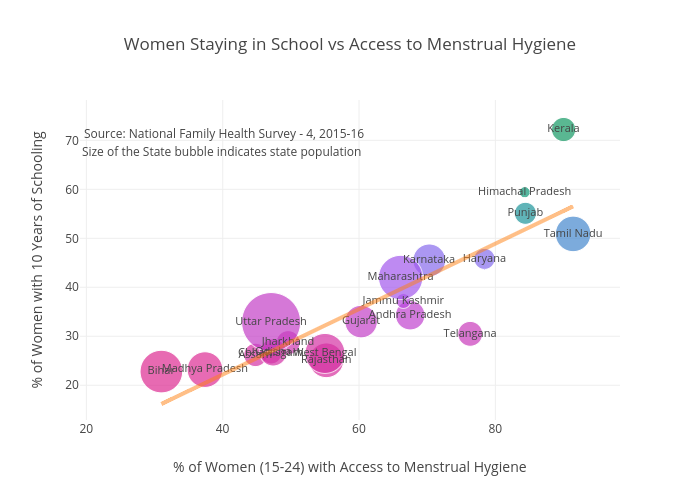
Nilakar's interactive graph and data of "Women Staying in School vs Access to Menstrual Hygiene" is a , showing C; with % of Women (15-24) with Access to Menstrual Hygiene in the x-axis and % of Women with 10 Years of Schooling in the y-axis.. The x-axis shows values from 24.97545970467101 to 97.02148709979893. The y-axis shows values from 12.910452549286056 to 78.34337376375466. This visualization has the following annotations: Source: National Family Health Survey - 4, 2015-16; Size of the State bubble indicates state population