Edit chart
Loading graph
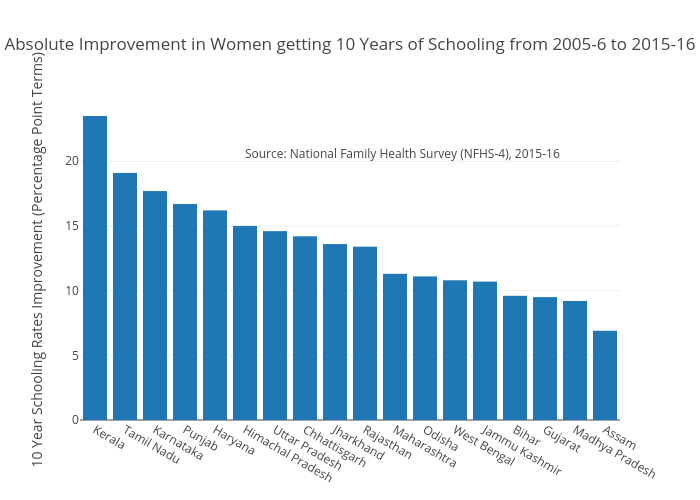
Nilakar's interactive graph and data of "Absolute Improvement in Women getting 10 Years of Schooling from 2005-6 to 2015-16" is a bar chart, showing D; with 10 Year Schooling Rates Improvement (Percentage Point Terms) in the y-axis. The x-axis shows values from -0.5 to 17.5. The y-axis shows values from 0 to 24.736842105263158. This visualization has the following annotation: Source: National Family Health Survey (NFHS-4), 2015-16